Can fiber laser cleaners damage the underlying metal? Yes, but the risk depends on power density, pulse duration, scanning speed, and surface condition. A properly adjusted fiber laser can remove rust, paint, oxide, and oil while leaving the base metal intact. Poor settings can do the opposite. Excessive energy may cause discoloration, melting, surface pitting, or unwanted hardness changes.
Dr. Reinhart Poprawe, former director of Fraunhofer ILT, emphasizes a valuable principle: “Laser processing is always a matter of controlling energy and material response.” That idea applies directly to laser cleaning. The operator must understand the metal, coating thickness, contamination type, and heat sensitivity. Stainless steel may show visible color changes before serious damage occurs. Aluminum can reflect strongly, yet thin sections may still heat quickly. Carbon steel can tolerate aggressive cleaning, but edges and corners often receive too much exposure.
Small details matter.
In practical testing, professionals begin with low power and wider scanning patterns. They inspect the surface after every pass. A clean appearance does not automatically prove a safe result. Microscopic roughness or thermal changes may remain hidden. Even experienced technicians can misjudge a polished surface under poor lighting. Therefore, sample testing, calibrated equipment, and documented settings should guide production work. The safest answer is not simply “no.” Fiber laser cleaners can damage underlying metal when process control is neglected, but careful parameters can make the method precise, repeatable, and highly protective.
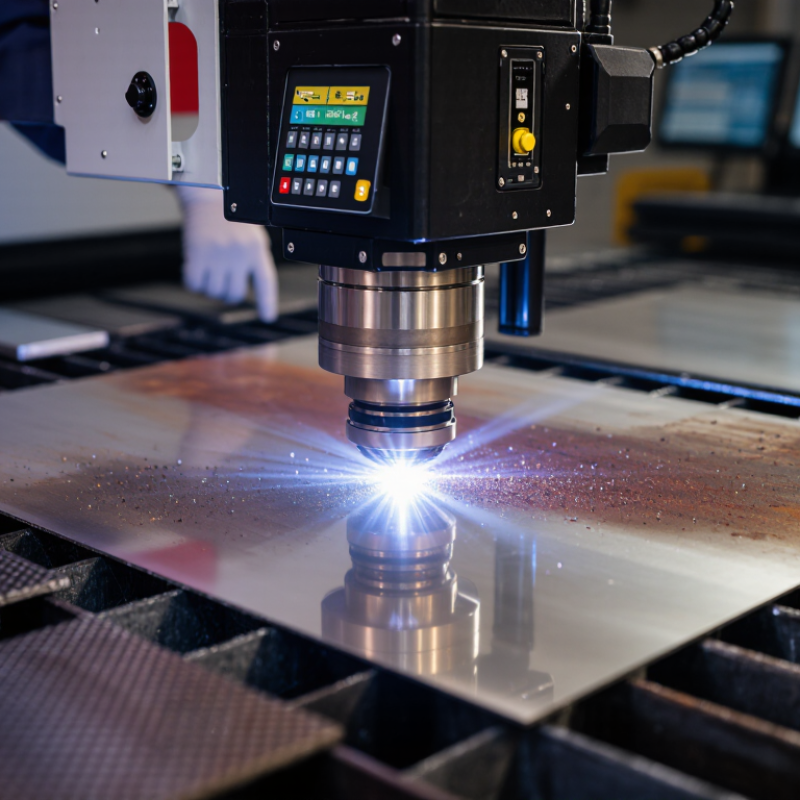
A 1064 nm fiber laser removes contaminants through pulsed ablation. Each short pulse delivers concentrated energy to rust, paint, oil, or oxide layers. The contaminated surface absorbs energy, heats rapidly, and forms vapor and plasma. The expanding plume carries loosened particles away from the workpiece.
The underlying metal may remain intact when the pulse energy, repetition rate, focus, and scanning speed are properly matched. However, “non-damaging” is not automatic. Excessive fluence can melt a thin surface layer, leave discoloration, or create microscopic pits. Reflective metals can also redirect part of the beam unexpectedly. In practice, cleaning a greasy steel bracket differs greatly from cleaning polished aluminum. A test area matters. I would inspect it under magnification, not trust appearance alone.
Tips: Begin with low power and wider scanning. Use several light passes instead of one aggressive pass. Keep the beam moving. Confirm the focal distance on a small test coupon, then check surface roughness and color changes. Monitor dust extraction, because ablated particles should not settle back onto the metal. Settings published for one material may fail on another. That is an inconvenient detail, but real surfaces are rarely uniform.
Can Fiber Laser Cleaners Damage the Underlying Metal?
A fiber laser cleaner can damage sound metal when energy exceeds the surface’s safe processing window. The stated range, 0.1–10 J/cm², is useful for comparison, but it is not a universal damage scale. Pulse duration, spot overlap, wavelength, and coating thickness strongly change the result.
At 0.1–1 J/cm², steel often shows limited thermal impact, although repeated passes may still create discoloration or altered surface texture. Aluminum reflects much of the incoming energy, yet its lower melting point makes concentrated heating risky. Copper reflects even more, so cleaning may become inefficient before visible damage appears. That can encourage operators to increase fluence too aggressively.
Around 1–3 J/cm², contamination removal may improve, but microscopic roughening becomes possible, especially on polished surfaces. Between 3 and 10 J/cm², localized melting, pitting, or heat-affected zones deserve serious attention. Thin aluminum edges and copper features are particularly vulnerable. Steel is usually more tolerant, but rust scale, alloy composition, and prior heat treatment still matter.
Real work requires a controlled test area. I examine the surface before and after cleaning using magnification, lighting changes, and, when available, profilometry. A single pass may look perfect. Repeated passes can tell a different story. This is where practical judgment sometimes fails: a clean appearance does not prove zero metallurgical change. Conservative settings, measured overlap, and documented inspection provide stronger evidence than fluence alone.
Representative single-pulse response of common engineering metals at 1064 nm with approximately 10 ns pulse duration. Actual results vary with alloy, surface finish, pulse overlap, repetition rate, spot size, and heat accumulation.
| Material | Fluence Range (J/cm²) |
Approx. Surface Energy per 1 mm² Spot |
Likely Single-Pulse Response | Damage Risk | Observable or Measurable Effect |
|---|---|---|---|---|---|
| Carbon Steel | 0.1–0.5 | 0.001–0.005 J | Minimal bulk-metal interaction | Low | Light removal of loose contamination; possible localized oxide heating on dark or already oxidized surfaces. |
| Carbon Steel | 0.5–1.0 | 0.005–0.010 J | Heating below clear ablation | Low–Moderate | Heat tint, oxide-color change, or a small increase in surface roughness may occur, especially with repeated pulses. |
| Carbon Steel | 1.0–3.0 | 0.010–0.030 J | Onset of localized melting or ablation | Moderate | Micropits, resolidified droplets, and measurable roughness changes become possible; the risk rises with pulse overlap. |
| Carbon Steel | 3.0–10.0 | 0.030–0.100 J | Strong melting and material removal | High | Visible pitting, cratering, melting, and potential dimensional loss. Not suitable for controlled cleaning of a finished surface. |
| Aluminum | 0.1–0.5 | 0.001–0.005 J | Surface heating with little bulk removal | Low | Usually no visible substrate damage from an isolated pulse; thin oxide films can be modified or locally disrupted. |
| Aluminum | 0.5–1.0 | 0.005–0.010 J | Thermal modification becomes possible | Low–Moderate | Gloss change, local oxide alteration, or slight roughening may appear on polished surfaces or during repeated scanning. |
| Aluminum | 1.0–3.0 | 0.010–0.030 J | Localized melting or ablation may begin | Moderate–High | Micropits and resolidified features are possible; the relatively low melting point makes heat accumulation particularly important. |
| Aluminum | 3.0–10.0 | 0.030–0.100 J | Substantial melting and material removal | High | Visible cratering, surface waviness, melting, and measurable loss of the underlying aluminum are likely. |
| Copper | 0.1–0.5 | 0.001–0.005 J | Limited thermal response | Low | Generally little effect from an isolated pulse; contamination or oxide layers may absorb more energy than clean copper. |
| Copper | 0.5–1.0 | 0.005–0.010 J | Localized heating without consistent ablation | Low–Moderate | Surface reflectivity or oxide condition may change; repeated pulses can produce slight roughness or thermal discoloration. |
| Copper | 1.0–3.0 | 0.010–0.030 J | Possible onset of melting or ablation | Moderate | Small melt features and micropits may occur, particularly where beam overlap or local absorption is high. |
| Copper | 3.0–10.0 | 0.030–0.100 J | Strong localized melting and removal | High | Cratering, melt ejection, resolidified droplets, and dimensional damage are possible despite copper’s high thermal conductivity. |
Reference basis: Representative trends are consistent with established laser–metal interaction data for nanosecond pulsed irradiation, including thermal diffusion, reflectivity, melting-point, and ablation-threshold behavior of iron-based alloys, aluminum, and copper. The energy-per-spot values use a 1 mm² illuminated area: 1 J/cm² = 0.01 J per mm².
Can Fiber Laser Cleaners Damage the Underlying Metal?
The answer depends on pulse energy, repetition rate, scanning speed, and surface condition. Under 10–100 ns laser pulses, heat can still enter the substrate before the pulse ends. The affected zone may be microscopic, yet metallurgically important. A clean surface is not proof of zero damage.
At 10 ns, energy remains highly concentrated, so evaporation or shallow melting may occur near the contamination layer. At 100 ns, thermal diffusion usually has more time to spread. This can enlarge the heat-affected zone, especially on thin steel, aluminum, or copper sheets. Dark oxides absorb more energy than polished metal. Reflective surfaces behave differently.
Look closely. A faint color change, softened edge, or tiny ripple can indicate excessive heating. Cross-sectional microscopy and microhardness testing provide stronger evidence than visual inspection. During process trials, I would record pulse width, fluence, hatch spacing, and scan speed for every sample. One pass may look harmless, while repeated overlap slowly raises the local temperature. That detail is easy to miss.
In practice, the first setting is rarely perfect. Operators should test on matching scrap, not only on thick coupons. Keep the beam moving, reduce overlap when possible, and inspect edges and recessed areas. Residual stress may not appear immediately. Sometimes the metal looks untouched, but its hardness has already changed.
Heat-affected zones under short laser pulses are strongly influenced by pulse duration. This chart shows the calculated thermal diffusion length in stainless steel using L = √(2αt), with a thermal diffusivity of approximately 4.0 × 10⁻⁶ m²/s. A shorter diffusion length generally indicates more localized heating, but actual surface damage also depends on fluence, repetition rate, scan speed, reflectivity, oxidation, and coating properties.
Can fiber laser cleaners damage the underlying metal? Yes, when delivered energy exceeds the surface’s thermal tolerance. Scan speed and overlap are major controls. A 100 W laser moving at 1,000 mm/s delivers 0.1 J/mm along the scan path. If speed drops to 500 mm/s, linear energy doubles to 0.2 J/mm. That change can increase melting, discoloration, or surface roughness, especially on thin steel or aluminum.
Overlap changes energy density across adjacent lines. With a 1 mm spot, 30% overlap creates a 0.7 mm hatch pitch. At 70% overlap, the pitch falls to 0.3 mm. Under identical power and speed, estimated areal energy rises from about 0.14 to 0.33 J/mm². That is more than double. Technical guidance in ISO 11553-1 emphasizes controlled laser processing, while surface-treatment studies published in the Journal of Laser Applications repeatedly identify scan speed, hatch spacing, and pulse energy as dominant damage variables.
A practical starting point is 30–50% overlap for light oxidation, followed by inspection under angled lighting. Heavy corrosion may need 50–70%, but repeated passes can quietly heat the substrate. Watch the edges. Warping, rainbow tint, or a rougher wipe pattern signals excessive exposure. These signs are easy to miss during fast cleaning. In my view, overlap should never be selected alone; a slower scan with high overlap can exceed the safe thermal window even when average power looks modest. Test coupons remain necessary, because published energy values cannot fully predict every alloy, coating, or contamination layer.
A clean appearance can mislead. Surface damage may begin as roughness, hardness change, or altered oxide chemistry. In practical inspections, measure the same area before and after cleaning. ISO 4288 recommends evaluating surface texture across five sampling lengths. Record Ra and Rz, not Ra alone. A small Ra increase can hide sharp valleys that later retain moisture. I would also photograph the scan path under identical lighting.
Hardness testing adds another warning signal. ASTM E384 supports microindentation testing for localized hardness changes. Place indents inside the cleaned zone, beside its boundary, and on an untouched reference area. Five readings per zone are a sensible minimum, although project specifications should control acceptance. A 5% to 10% hardness shift deserves review, especially on thin sections or heat-treated parts. That threshold is not universal. It is a practical screening value, not proof of damage.
Residual oxide requires chemical evidence. X-ray photoelectron spectroscopy usually examines only the upper 5–10 nanometres, while energy-dispersive analysis samples much deeper. Report oxygen content, oxide thickness, and measurement depth together. ISO 17025-based laboratories improve traceability through calibrated instruments and documented uncertainty. Cleaning trials should record laser fluence, pulse overlap, scan speed, and substrate temperature. One missed detail can distort the result. A duller surface is not automatically safer. Sometimes, the best inspection reveals an uncomfortable process window.
Yes, especially when energy exceeds steel’s safe processing window. At 0.1–1 J/cm², damage may appear as discoloration or changed texture. Repeated passes matter. A clean surface may still hide metallurgical changes.
Often, yes. Aluminum reflects energy but melts at a relatively low temperature. Thin edges can heat quickly and develop localized melting or pits. Use conservative settings and inspect the edge under magnification.
Copper reflects even more incoming energy, so cleaning may remain inefficient. Operators might increase energy too aggressively. That is risky. Visible damage may appear later as pitting or altered surface texture.
Contamination removal may improve, but microscopic roughening can begin. Polished surfaces deserve extra attention. Small valleys may retain moisture even when Ra changes only slightly.
Localized melting, pitting, and heat-affected zones become more likely. Thin aluminum sections and copper features are particularly vulnerable. Steel usually tolerates more energy, but alloy and heat treatment still matter.
Compare the same area under identical lighting and magnification. Photograph the scan path before and after treatment. Measure roughness across five sampling lengths, recording both Ra and Rz. One pass can look perfect. Repeated passes may tell another story.
Yes. Microindentation can identify localized hardness changes. Test inside the cleaned zone, beside its boundary, and on untouched metal. Five readings per zone provide a practical minimum. A 5%–10% shift deserves review, but it is not universal proof of damage.
Chemical analysis should report oxygen content, oxide thickness, and measurement depth together. Surface-sensitive analysis may examine only the upper 5–10 nanometres. Deeper elemental analysis can produce a different result. That difference matters. Calibration and documented uncertainty improve confidence.
Record fluence, pulse overlap, scan speed, and substrate temperature. Also note alloy type, coating thickness, pass count, and inspection lighting. A missed setting can distort the comparison. I would not rely on fluence alone.
Can fiber laser cleaners damage the underlying metal? The answer depends on how laser energy is controlled. A 1064 nm fiber laser removes rust, paint, and other contaminants through pulsed ablation, where short bursts break down surface materials and limit heat transfer into the substrate. However, excessive fluence can damage the base metal. Thresholds vary among steel, aluminum, and copper, particularly across energy levels of 0.1–10 J/cm², so settings must be matched to the material and contaminant.
Pulses lasting 10–100 ns may create a small heat-affected zone, but excessive energy, slow scanning, or repeated passes can increase discoloration, melting, roughness, or hardness changes. Scan speed and a controlled overlap of approximately 30–70% help distribute cleaning energy evenly while avoiding untreated gaps and unnecessary heating. After cleaning, inspection should include surface roughness, hardness, and residual oxide measurements to confirm that contaminants were removed without compromising the metal’s performance.

Jigsaw Machine